Dashboard of Kubernetes
Install
Add helm repository:
$ helm repo add kubernetes-dashboard https://kubernetes.github.io/dashboard/
"kubernetes-dashboard" has been added to your repositories
Then install it using helm:
$ helm pull kubernetes-dashboard/kubernetes-dashboard
$ helm upgrade --install kubernetes-dashboard kubernetes-dashboard-7.12.0.tgz --create-namespace -n kubernetes-dashboard
Release "kubernetes-dashboard" does not exist. Installing it now.
NAME: kubernetes-dashboard
LAST DEPLOYED: Wed May 14 10:50:36 2025
NAMESPACE: kubernetes-dashboard
STATUS: deployed
REVISION: 1
TEST SUITE: None
NOTES:
*************************************************************************************************
*** PLEASE BE PATIENT: Kubernetes Dashboard may need a few minutes to get up and become ready ***
*************************************************************************************************

Congratulations! You have just installed Kubernetes Dashboard in your cluster.

To access Dashboard run:
  kubectl -n kubernetes-dashboard port-forward svc/kubernetes-dashboard-kong-proxy 8443:443

NOTE: In case port-forward command does not work, make sure that kong service name is correct.
      Check the services in Kubernetes Dashboard namespace using:
        kubectl -n kubernetes-dashboard get svc

Dashboard will be available at:
  https://localhost:8443
Create service account
Create file admin_sa.yaml for the service account and role binding:
apiVersion: v1
kind: ServiceAccount
metadata:
  name: admin
  namespace: kubernetes-dashboard
---
apiVersion: rbac.authorization.k8s.io/v1
kind: ClusterRoleBinding
metadata:
  name: admin-cluster-admin
roleRef:
  apiGroup: rbac.authorization.k8s.io
  kind: ClusterRole
  name: cluster-admin
subjects:
  - kind: ServiceAccount
    name: admin
    namespace: kubernetes-dashboard
Apply it:
$ kubectl apply -f admin_sa.yaml
serviceaccount/admin created
clusterrolebinding.rbac.authorization.k8s.io/admin-cluster-admin created
Expose the service
Check the dashboard services:
$ kubectl get svc -n kubernetes-dashboard
NAME                                   TYPE        CLUSTER-IP      EXTERNAL-IP   PORT(S)    AGE
kubernetes-dashboard-api               ClusterIP   10.102.73.10    <none>        8000/TCP   28m
kubernetes-dashboard-auth              ClusterIP   10.109.188.23   <none>        8000/TCP   28m
kubernetes-dashboard-kong-proxy        ClusterIP   10.103.23.118   <none>        443/TCP    28m
kubernetes-dashboard-metrics-scraper   ClusterIP   10.109.108.89   <none>        8000/TCP   28m
kubernetes-dashboard-web               ClusterIP   10.98.25.242    <none>        8000/TCP   28m
Expose the kong-proxy service:
$ kubectl -n kubernetes-dashboard port-forward --address=0.0.0.0 svc/kubernetes-dashboard-kong-proxy 8443:443
The exposed port is 8443.
Note
Port forwarding is running on the host where the command is emitted, and will be ceased if the command quit. You can make the service available outside simply by modify service type to NodePort:
$ kubectl patch service/kubernetes-dashboard-kong-proxy -n kubernetes-dashboard -p '{"spec": {"type": "NodePort"}}'
service/kubernetes-dashboard-kong-proxy patched
Find the exposed node port:
$ kubectl get -o template --template='{{range .spec.ports}}{{if .name | eq "kong-proxy-tls"}}{{.nodePort}}{{end}}{{end}}' service/kubernetes-dashboard-kong-proxy -n kubernetes-dashboard
32712
The port is exposed on each node in the cluster.
Open the dashboard in your browser using https scheme with the host name of your node and exposed port.
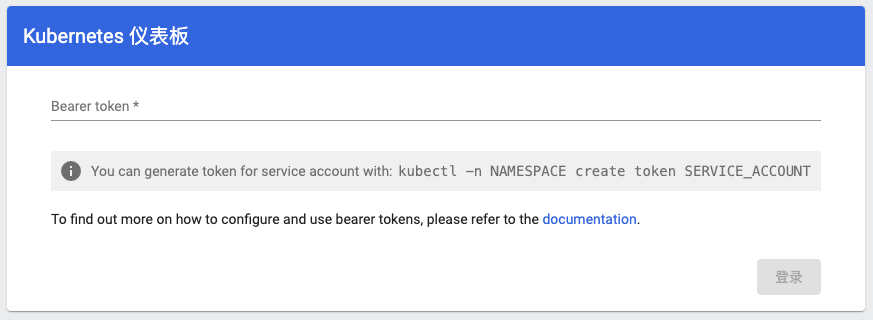
Generate a token for the user:
$ kubectl -n kubernetes-dashboard create token admin
Paste the output token into the login page.
Tip
Restart coredns may solve some network problem:
$ kubectl rollout restart deploy coredns -n kube-system
deployment.apps/coredns restarted